Already a while ago, I had to come up with illustrations for a case study on Helsinki’s public transit and its possible future developments. For one reason or another, the whole study was never finished or published and everything ended up in a stray folder on my computer’s hard disk. Cleaning it up I recently stumbled upon the maps and chart and was positively surprised of my 2014 self: I really still like them!
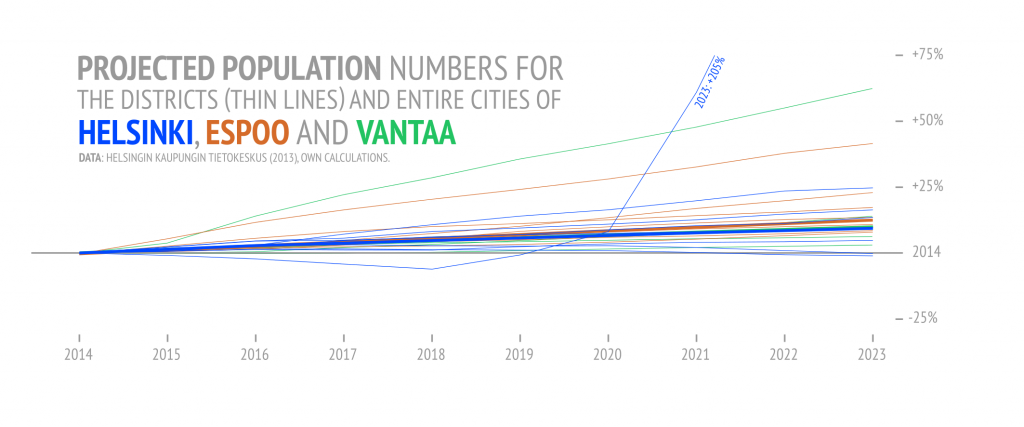
From a dataviz perspective I especially like how I implemented the legends. For the chart I even managed to eliminate it altogether by sharing a legend’s duty between the title and the data itself. Making the chart literally self-explaining.
But now the exhibits:
First, there is this chart which was to illustrate a short chapter on a new overspill development in the east of the city’s territory. It does nothing but show the city government’s projection of population numbers (plus a bit of interpolation in between).
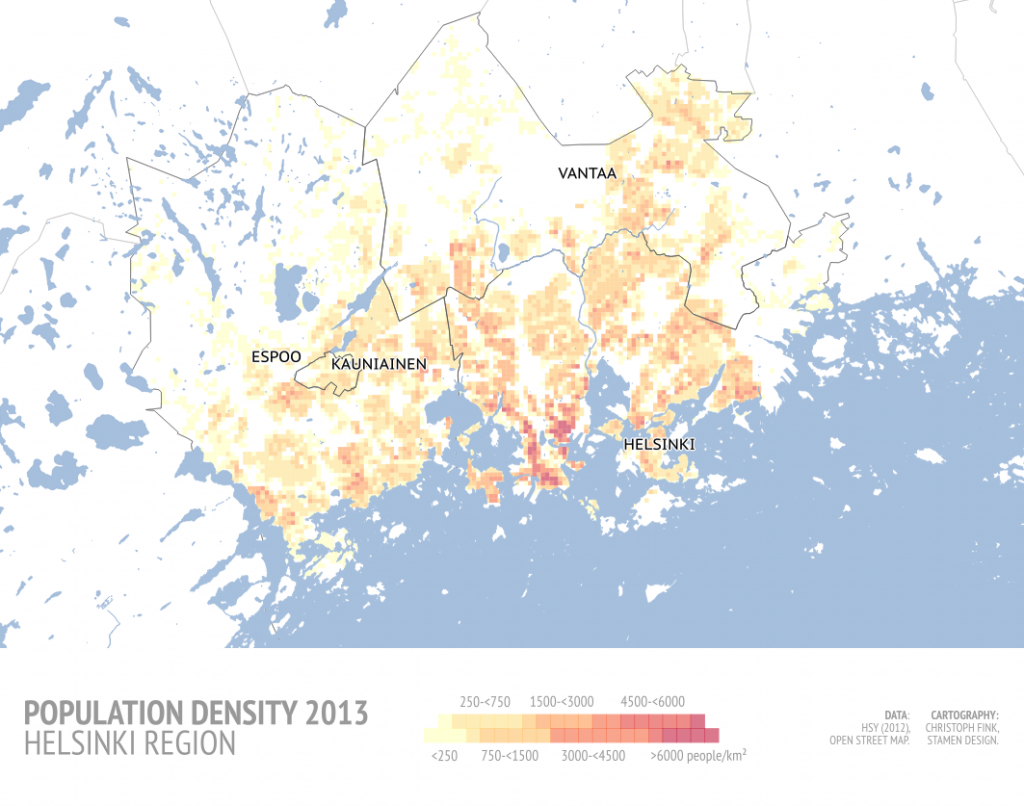
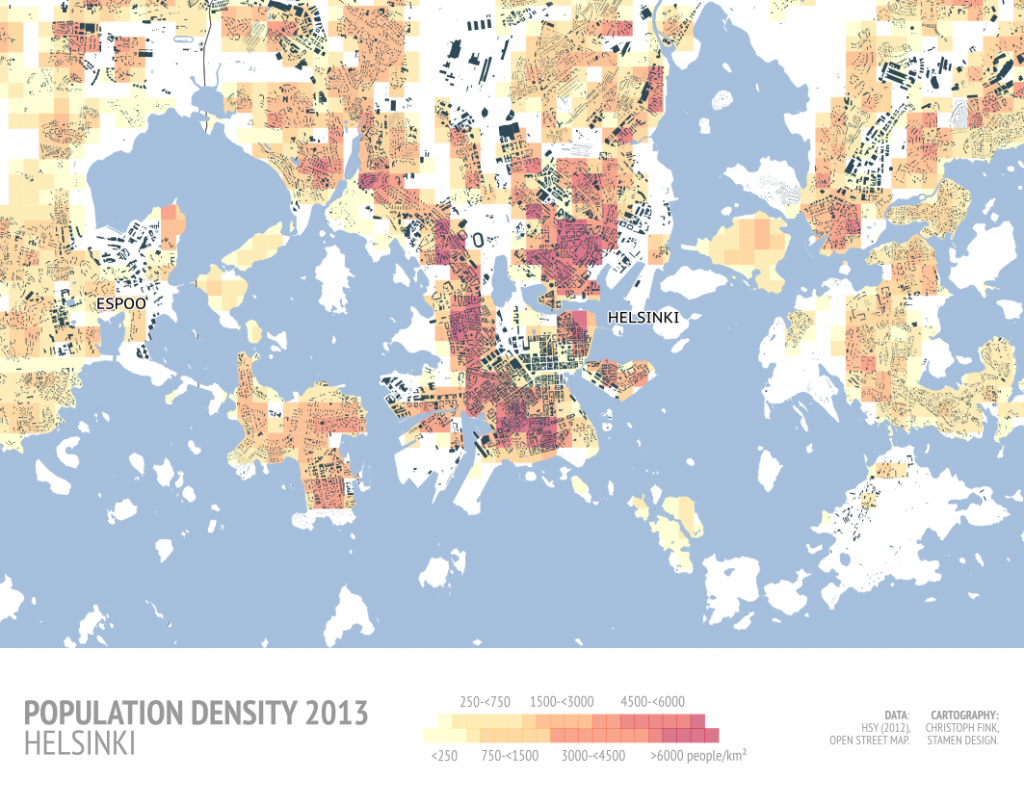
Then, here’s the first map: It shows the population density in the Helsinki metropolitan region: the three cities of Helsinki, Vantaa and Espoo, having grown together so tight over the years you couldn’t tell where one ends and the other one starts.
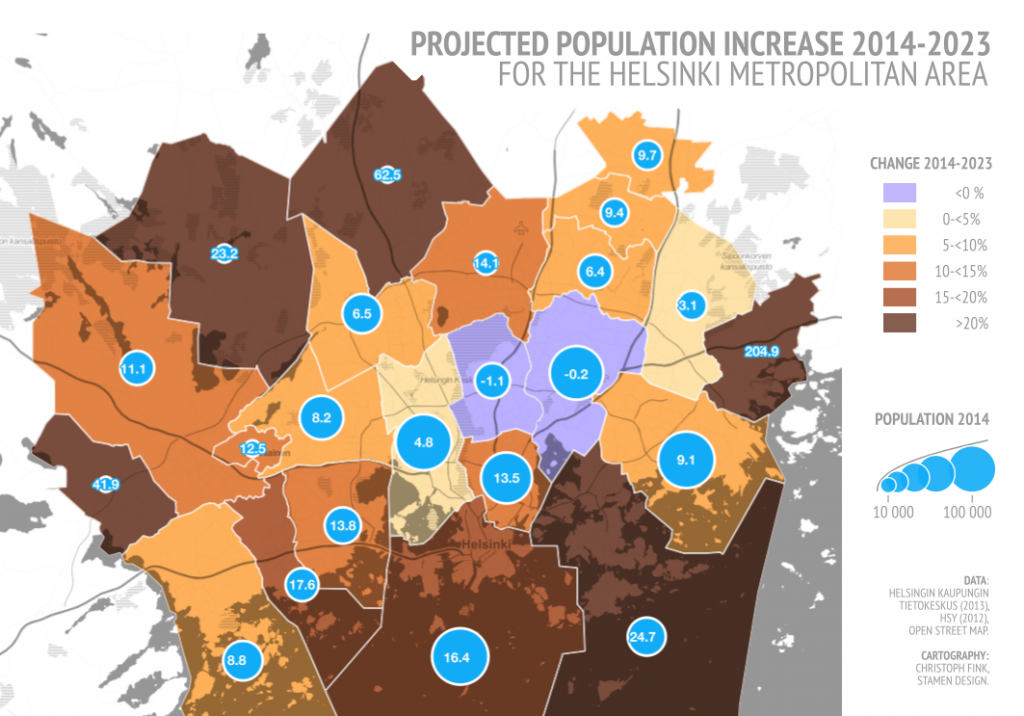
Another map, and that’s the only illustration in this set which I am not really content with, tries to tell two stories at once: a district’s population growth AND its absolute number. The main message the map transports – and it does well so I think – is that the fastest growing districts are the ones with both the largest area and the smallest population. Helsinki is sub-urbanising?
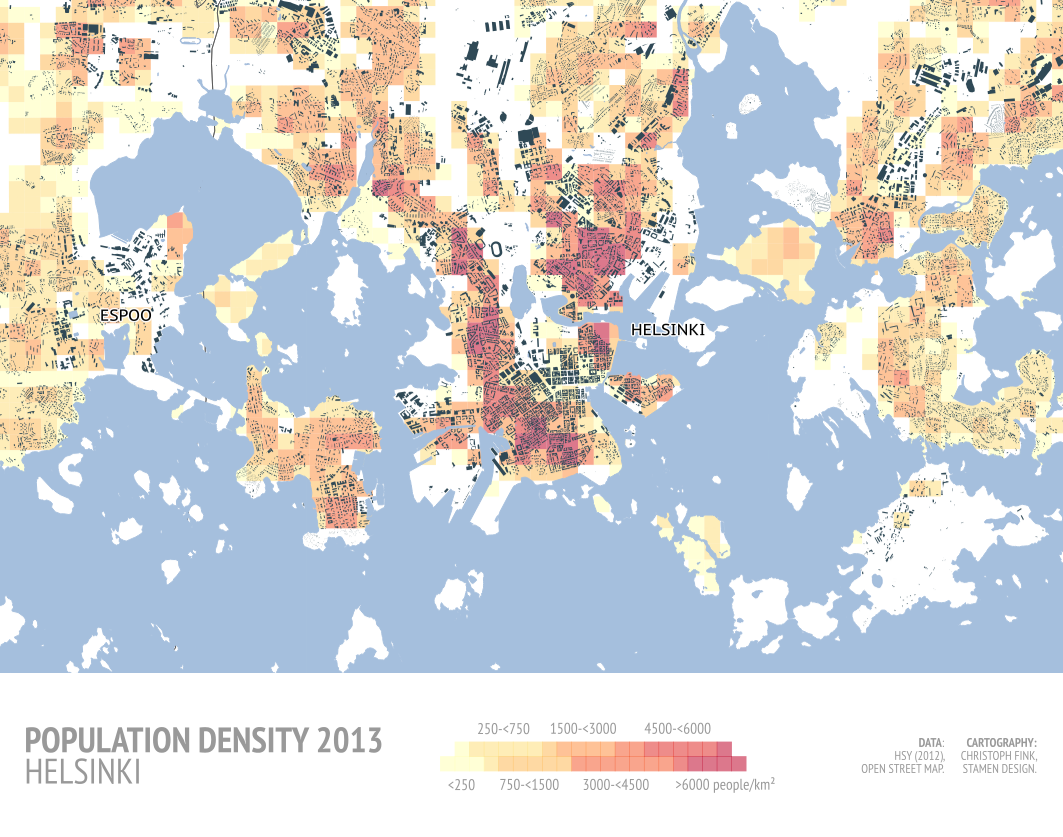
Finally, another map demonstrates how quickly population density declines outside of the very centre of the city. The neighbourhoods of Kallio and Tölö, both hardly 2 km from the centre, still have fairly high density housing, but even in the core of neighbouring Espoo, itself boasting a quarter-million inhabitants, the density is not even half.
All data used is either Open Government Data of the Helsinki Region, data from the Open Street Map project, or from the Natural Earth Data initiative. I realise in the maps’ legends I refer to the wonderful Stamen as a source, but now I can’t see their products anywhere: They definitely remain an important influence.
